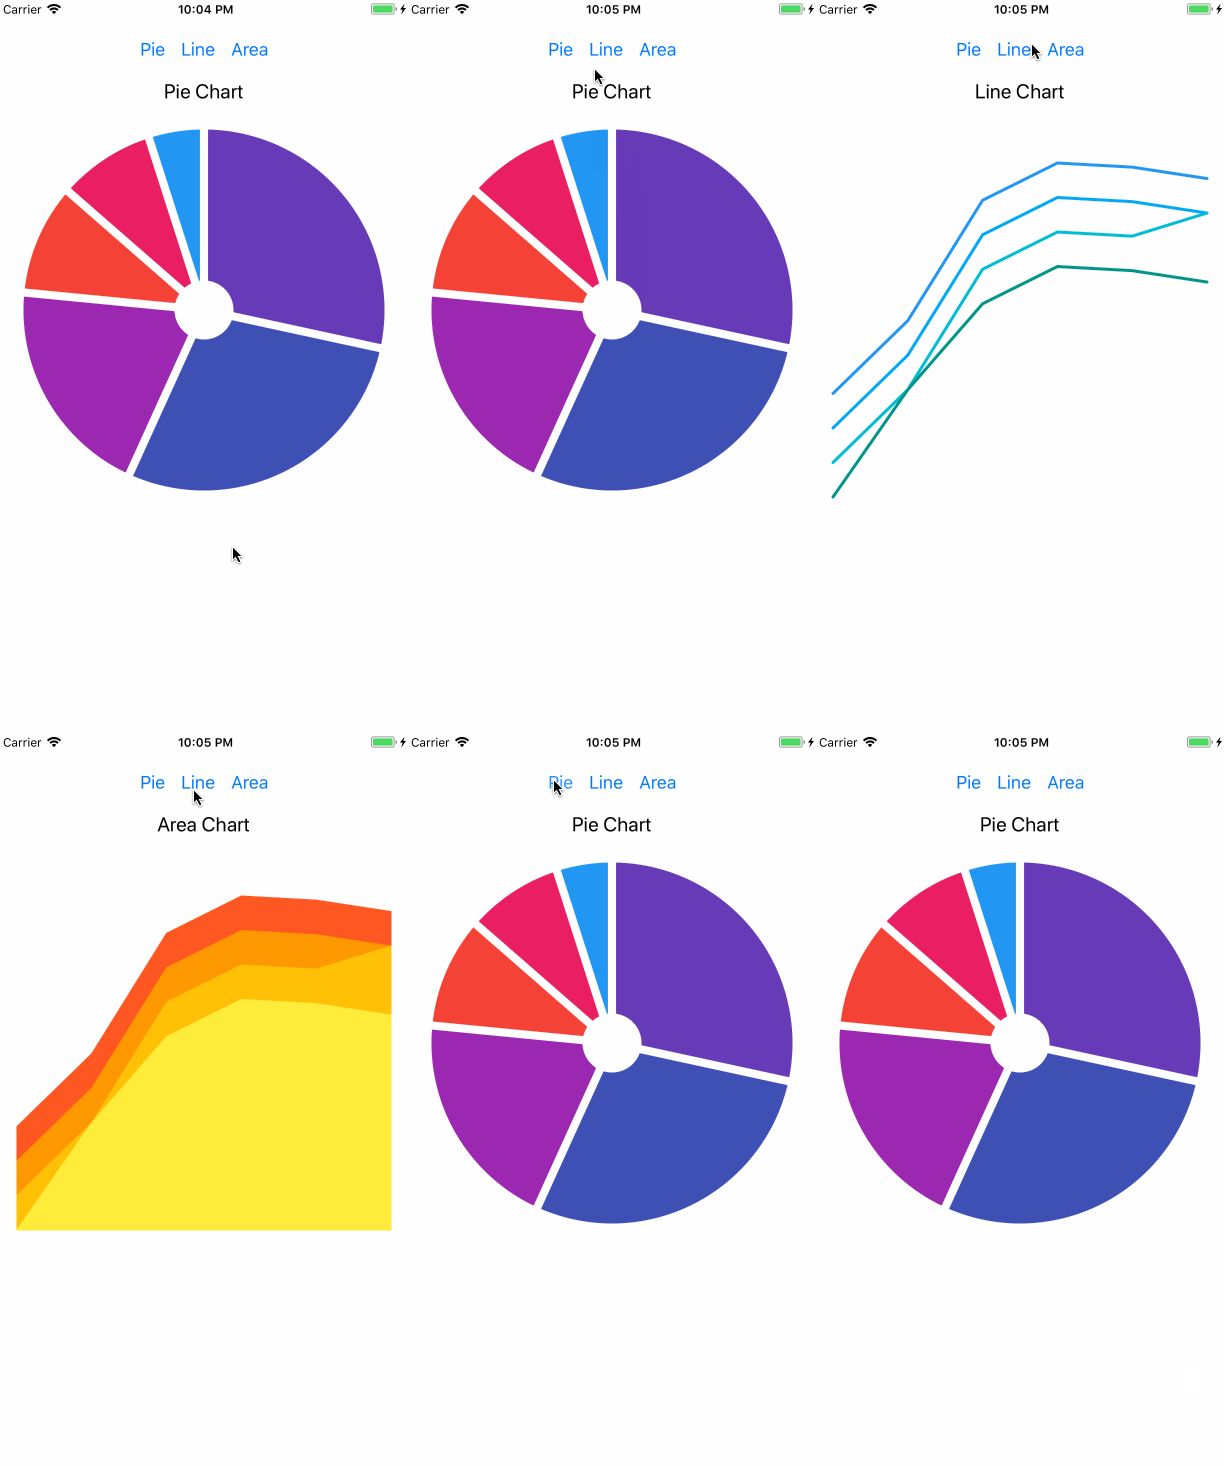
D3毋庸置疑,是JavaScript界的顶尖者,用过D3做图表的都知道其性能的厉害。最近使用ReactNative绘制图表,github开源的控件总是有兼容问题,于是就自己搜集各种资料使用D3远程绘制,嵌入ReactNative中。

import React, { Component } from 'react'
import {
  ART,
  AppRegistry,
  StyleSheet,
  View,
  Text,
  Dimensions,
  Button
} from 'react-native'
import * as d3scale from 'd3-scale'
import * as d3shape from 'd3-shape'
import * as d3Array from 'd3-array'
console.disableYellowBox = true
const {
  Surface,
  Group,
  Shape
} = ART
const { width } = Dimensions.get('window')
const pieData = [
  { number: 8, name: 'Fun activities' },
  { number: 7, name: 'Dog' },
  { number: 16, name: 'Food' },
  { number: 23, name: 'Car' },
  { number: 23, name: 'Rent' },
  { number: 4, name: 'Misc' }
]
const lineData = [
  [
    { date: new Date(2017, 9, 24), value: 93.24 },
    { date: new Date(2017, 9, 25), value: 95.35 },
    { date: new Date(2017, 9, 26), value: 98.84 },
    { date: new Date(2017, 9, 27), value: 99.92 },
    { date: new Date(2017, 9, 28), value: 99.80 },
    { date: new Date(2017, 9, 29), value: 99.47 }
  ], [
    { date: new Date(2017, 9, 24), value: 92.24 },
    { date: new Date(2017, 9, 25), value: 94.35 },
    { date: new Date(2017, 9, 26), value: 97.84 },
    { date: new Date(2017, 9, 27), value: 98.92 },
    { date: new Date(2017, 9, 28), value: 98.80 },
    { date: new Date(2017, 9, 29), value: 98.47 }
  ], [
    { date: new Date(2017, 9, 24), value: 91.24 },
    { date: new Date(2017, 9, 25), value: 93.35 },
    { date: new Date(2017, 9, 26), value: 96.84 },
    { date: new Date(2017, 9, 27), value: 97.92 },
    { date: new Date(2017, 9, 28), value: 97.80 },
    { date: new Date(2017, 9, 29), value: 98.47 }
  ], [
    { date: new Date(2017, 9, 24), value: 90.24 },
    { date: new Date(2017, 9, 25), value: 93.35 },
    { date: new Date(2017, 9, 26), value: 95.84 },
    { date: new Date(2017, 9, 27), value: 96.92 },
    { date: new Date(2017, 9, 28), value: 96.80 },
    { date: new Date(2017, 9, 29), value: 96.47 }
  ]
]
const areaData = [
  [
    { date: new Date(2017, 9, 24), value1: 93.24, value0: 92.24  },
    { date: new Date(2017, 9, 25), value1: 95.35, value0: 94.35  },
    { date: new Date(2017, 9, 26), value1: 98.84, value0: 97.84  },
    { date: new Date(2017, 9, 27), value1: 99.92, value0: 98.92  },
    { date: new Date(2017, 9, 28), value1: 99.80, value0: 98.80  },
    { date: new Date(2017, 9, 29), value1: 99.47, value0: 98.47  }
  ], [
    { date: new Date(2017, 9, 24), value1: 92.24, value0: 91.24 },
    { date: new Date(2017, 9, 25), value1: 94.35, value0: 93.35 },
    { date: new Date(2017, 9, 26), value1: 97.84, value0: 96.84 },
    { date: new Date(2017, 9, 27), value1: 98.92, value0: 97.92 },
    { date: new Date(2017, 9, 28), value1: 98.80, value0: 97.80 },
    { date: new Date(2017, 9, 29), value1: 98.47, value0: 98.47 }
  ], [
    { date: new Date(2017, 9, 24), value1: 91.24, value0: 90.24 },
    { date: new Date(2017, 9, 25), value1: 93.35, value0: 93.35 },
    { date: new Date(2017, 9, 26), value1: 96.84, value0: 95.84 },
    { date: new Date(2017, 9, 27), value1: 97.92, value0: 96.92 },
    { date: new Date(2017, 9, 28), value1: 97.80, value0: 96.80 },
    { date: new Date(2017, 9, 29), value1: 98.47, value0: 96.47 }
  ], [
    { date: new Date(2017, 9, 24), value1: 90.24, value0: 90.24 },
    { date: new Date(2017, 9, 25), value1: 93.35, value0: 90.24 },
    { date: new Date(2017, 9, 26), value1: 95.84, value0: 90.24 },
    { date: new Date(2017, 9, 27), value1: 96.92, value0: 90.24 },
    { date: new Date(2017, 9, 28), value1: 96.80, value0: 90.24 },
    { date: new Date(2017, 9, 29), value1: 96.47, value0: 90.24 }
  ]
]
const colors = [
  '#F44336', '#E91E63', '#9C27B0', '#673AB7', '#3F51B5',
  '#2196F3', '#03A9F4', '#00BCD4', '#009688', '#4CAF50',
  '#8BC34A', '#CDDC39', '#FFEB3B', '#FFC107', '#FF9800',
  '#FF5722'
]
export default class d3example extends Component {
  constructor(props) {
    super(props)
    this.state = { chart: 'pie' }
  }
  renderButtons() {
    return (
      <View style={{ height: 60, marginTop: 20, flexDirection: 'row', alignItems: 'center', justifyContent: 'center' }}>
        <Button title="Pie" onPress={() => this.setState({ chart: 'pie' })} />
        <Button title="Line" onPress={() => this.setState({ chart: 'line' })} />
        <Button title="Area" onPress={() => this.setState({ chart: 'area' })} />
      </View>
    )
  }
  renderPieChart() {
    const arcs = d3shape.pie().value((item) => item.number)(pieData)
    const pieChart = { paths: [] }
    arcs.map((arc, index) => {
      const path = d3shape.arc().outerRadius(180).padAngle(.05).innerRadius(30)(arc)
      pieChart.paths.push({ path })
    })
    return (
      <View style={{ alignItems: 'center' }}>
        <Text style={{ fontSize: 20 }}>Pie Chart</Text>
        <Surface width={width} height={width}>
          <Group x={width / 2} y={width / 2}>
            {
              pieChart.paths.map((item, index) =>
                (
                  <Shape
                    key={`pie_shape_${index}`}
                    fill={colors[index]}
                    stroke={colors[index]}
                    d={item.path}
                  />
                )
              )
            }
          </Group>
        </Surface>
      </View>
    )
  }
  renderLineChart() {
    const y = d3scale.scaleLinear().domain([90.24, 99.92]).range([width - 80, 0])
    const x = d3scale.scaleTime().domain([new Date(2017, 9, 24), new Date(2017, 9, 29)]).range([0, width - 40])
    const lineChart = { paths: [] }
    lineData.map((line, index) => {
      const path = d3shape.line().x((d) => x(d.date)).y((d) => y(d.value))(line)
      lineChart.paths.push({ path })
    })
    return (
      <View style={{ alignItems: 'center' }}>
        <Text style={{ fontSize: 20 }}>Line Chart</Text>
        <Surface width={width} height={width}>
          <Group x={20} y={60}>
            {
              lineChart.paths.map((item, index) =>
                (
                  <Shape
                    key={`line_shape_${index}`}
                    d={item.path}
                    stroke={colors[index + 5]}
                    strokeWidth={3}
                  />
                )
              )
            }
          </Group>
        </Surface>
      </View>
    )
  }
  renderAreaChart() {
    const y = d3scale.scaleLinear().domain([90.24, 99.92]).range([width - 80, 0])
    const x = d3scale.scaleTime().domain([new Date(2017, 9, 24), new Date(2017, 9, 29)]).range([0, width - 40])
    const areaChart = { paths: [] }
    areaData.map((area, index) => {
      const path = d3shape.area().x((d) => x(d.date)).y1((d) => y(d.value1)).y0((d) => y(d.value0))(area)
      areaChart.paths.push({ path })
    })
    return (
      <View style={{ alignItems: 'center' }}>
        <Text style={{ fontSize: 20 }}>Area Chart</Text>
        <Surface width={width} height={width}>
          <Group x={20} y={60}>
            {
              areaChart.paths.map((item, index) =>
                (
                  <Shape
                    key={`area_shape_${index}`}
                    d={item.path}
                    stroke={colors[colors.length - (index + 1)]}
                    fill={colors[colors.length - (index + 1)]}
                  />
                )
              )
            }
          </Group>
        </Surface>
      </View>
    )
  }
  render() {
    let chart
    switch (this.state.chart) {
      case 'pie':
        chart = this.renderPieChart()
        break
      case 'line':
        chart = this.renderLineChart()
        break
      case 'area':
        chart = this.renderAreaChart()
        break
      default:
        chart = this.renderPieChart()
    }
    return (
      <View style={{ flex: 1 }}>
        {this.renderButtons()}
        {chart}
      </View>
    );
  }
}
AppRegistry.registerComponent('d3example', () => d3example);
参考网站:
本帖有隐藏内容,请您回复后查看。
收藏的用户(0)
X
正在加载信息~
2
最新回复 (0)

